Learn how to useClutch Parlays
Everything you need to know about using Clutch, understanding betting data, and making smarter picks.
Platform Overview
What is Clutch Parlays?
Clutch is the easiest way to see upcoming bets from the biggest sportsbooks, find trends, build parlays, and track performance.
How to Get Started
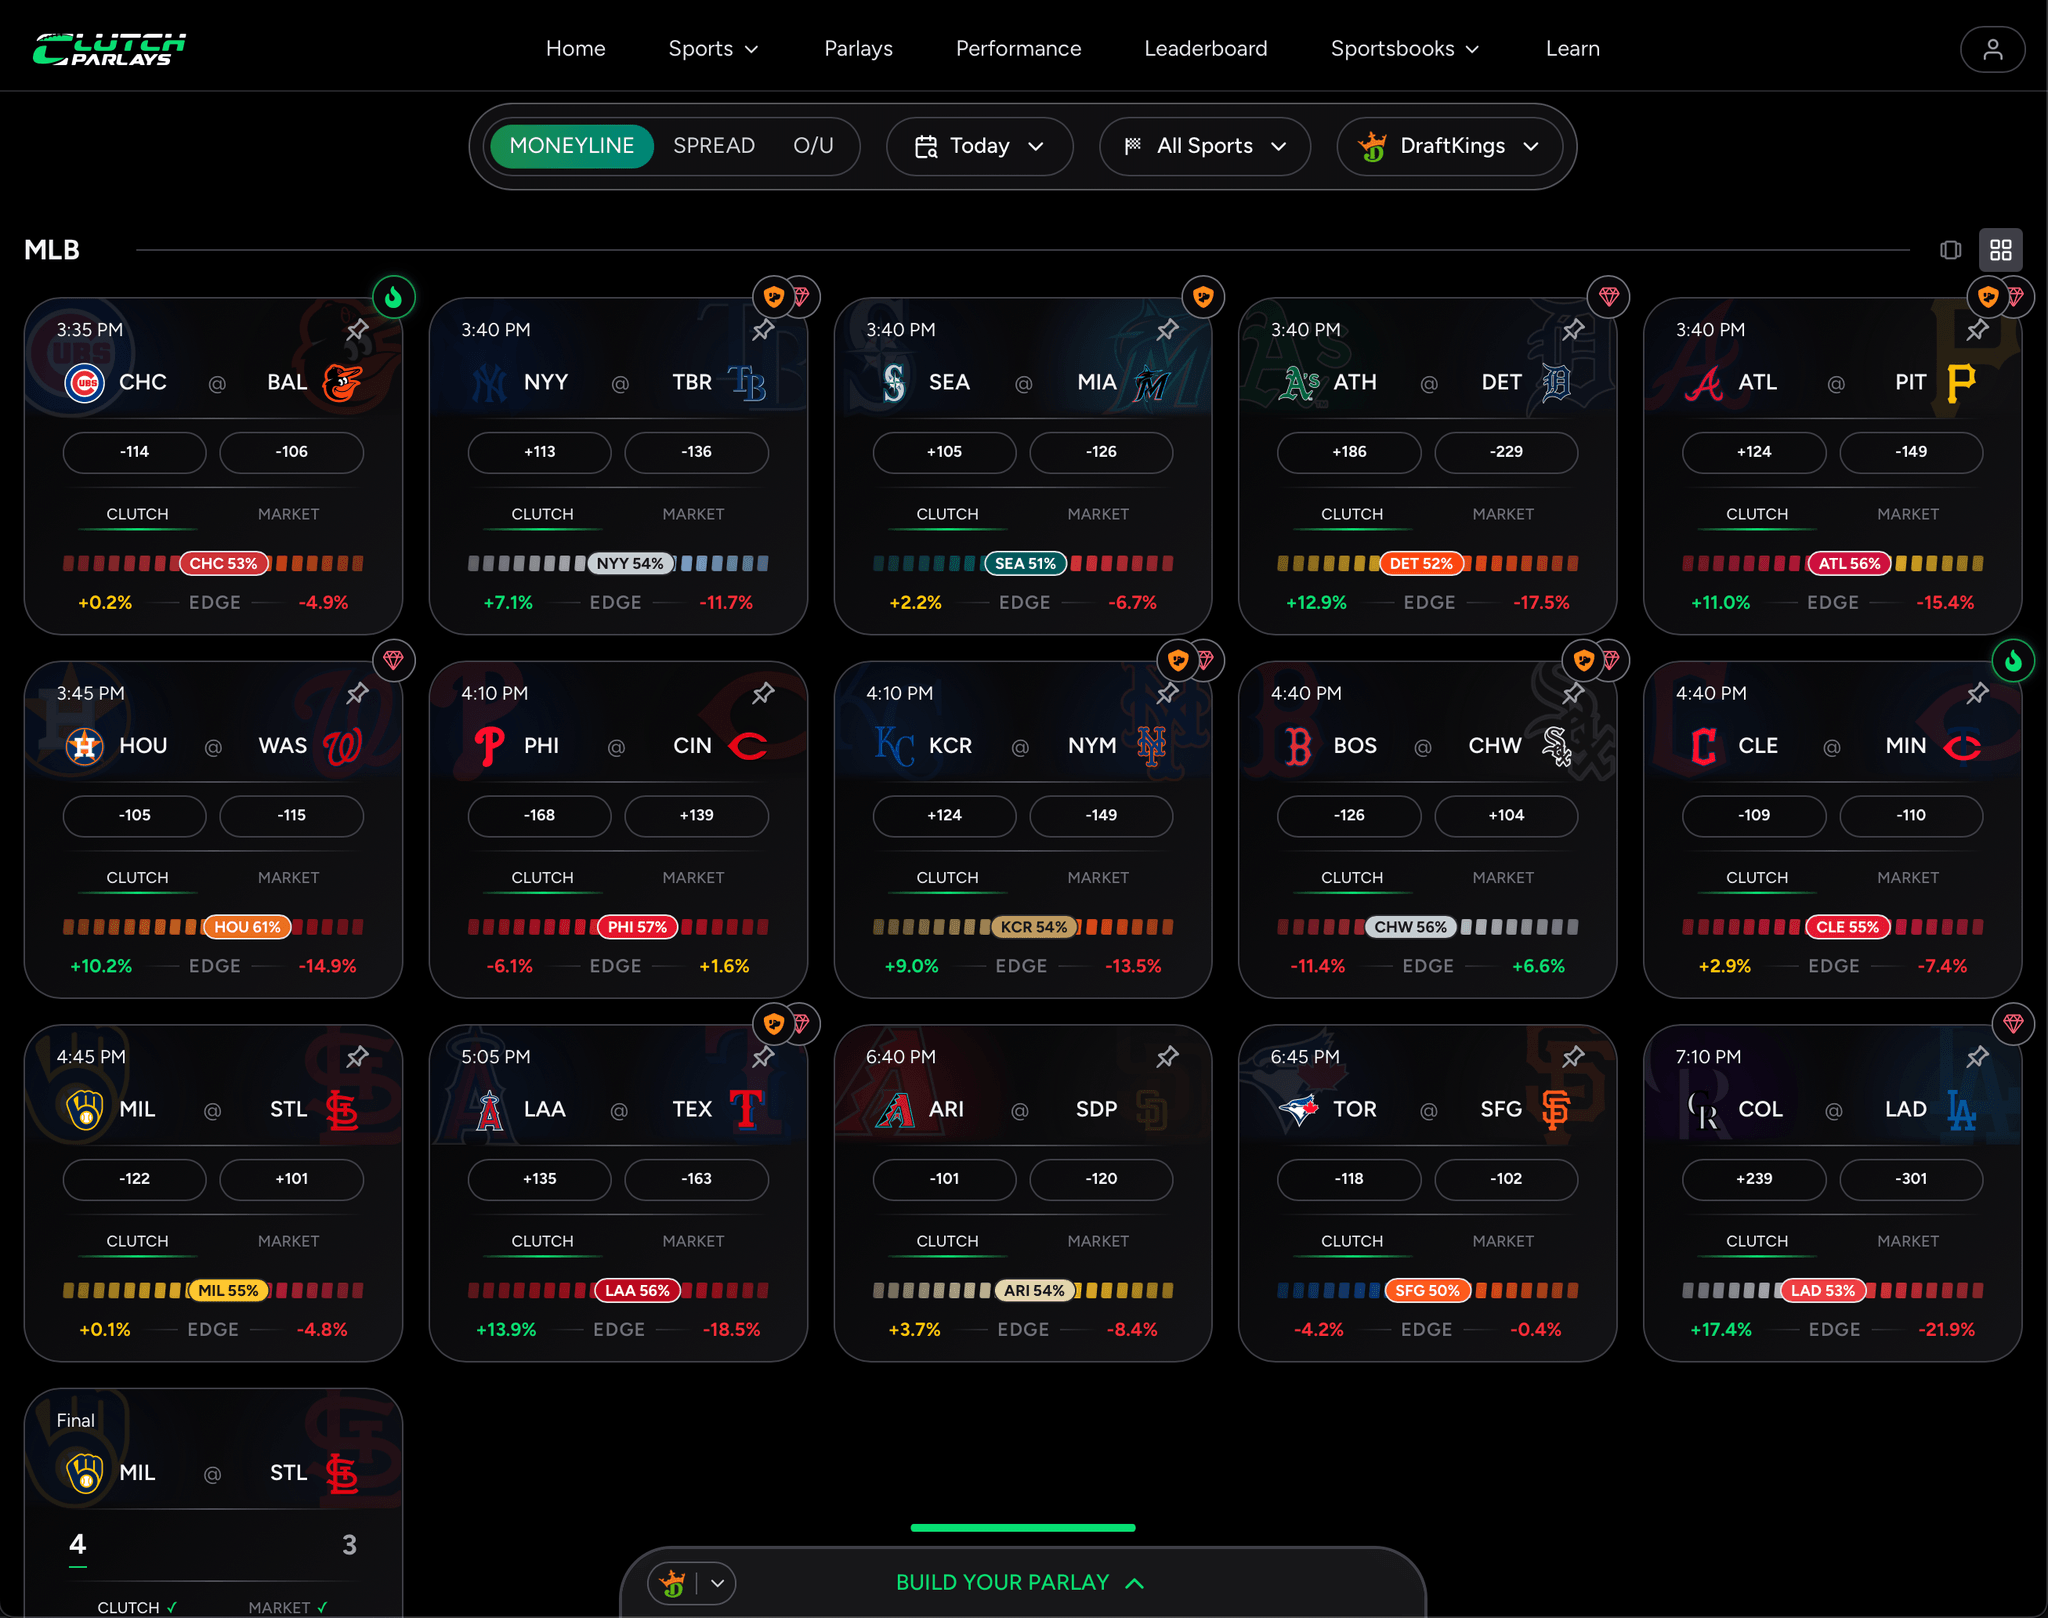
Browse today's games
Start on the Home or Sports page to see every upcoming matchup with live odds, AI predictions, and at-a-glance value signals.
Step 1.1 — Deep Dive
The Filter Bar
Every page is shaped by four global filters. Set them once and the entire site — cards, predictions, parlays — re-tunes to match.
Bet Type
Switch between moneyline, spread, and over/under. Cards re-render with the matching odds, lines, and predictions.
Date
Browse today, tomorrow, or scroll backward to study how past games landed. Only dates with games are selectable.
Sport
Filter by league — NBA, NFL, MLB, MLS (Coming soon). Each sport has its own models, props, and metric suite.
Bookmakers
Choose which sportsbooks to compare. Lines, prices, and the best-line highlight all come from this set.
Step 1.2 — Deep Dive
The Game Card
Each card is a single matchup, distilled. Teams, lines, our model's read, and the action you can take on it — all in one tap-friendly tile.
Hot badges
Flags how accurate our model has been on these teams over the last 30 days. Green means one team has been highly predictable; amber means both have.
Pick buttons
Tap either side to add the bet to your parlay. The chosen side glows green; tap again to remove.
Tap to dive in
Click anywhere on the card to open the full game page — deeper model breakdowns, line movement, player props, and matchup history.
Prediction slider
Shows our model's probability for each side and the implied edge versus the sportsbook price. Tap Market to flip the slider over to what the bookmakers think will happen — handy for comparing our read against the line.
Pin a game
Tap the pin in the top-right to pin a matchup to the top of your home page — easy to monitor without hunting for it.


Starts in 2h 34m
LAL
BOS
How to Get Started
The game page
Live odds and our model's pick across every bet type, side by side with head-to-head stats and stat leaders for the matchup.
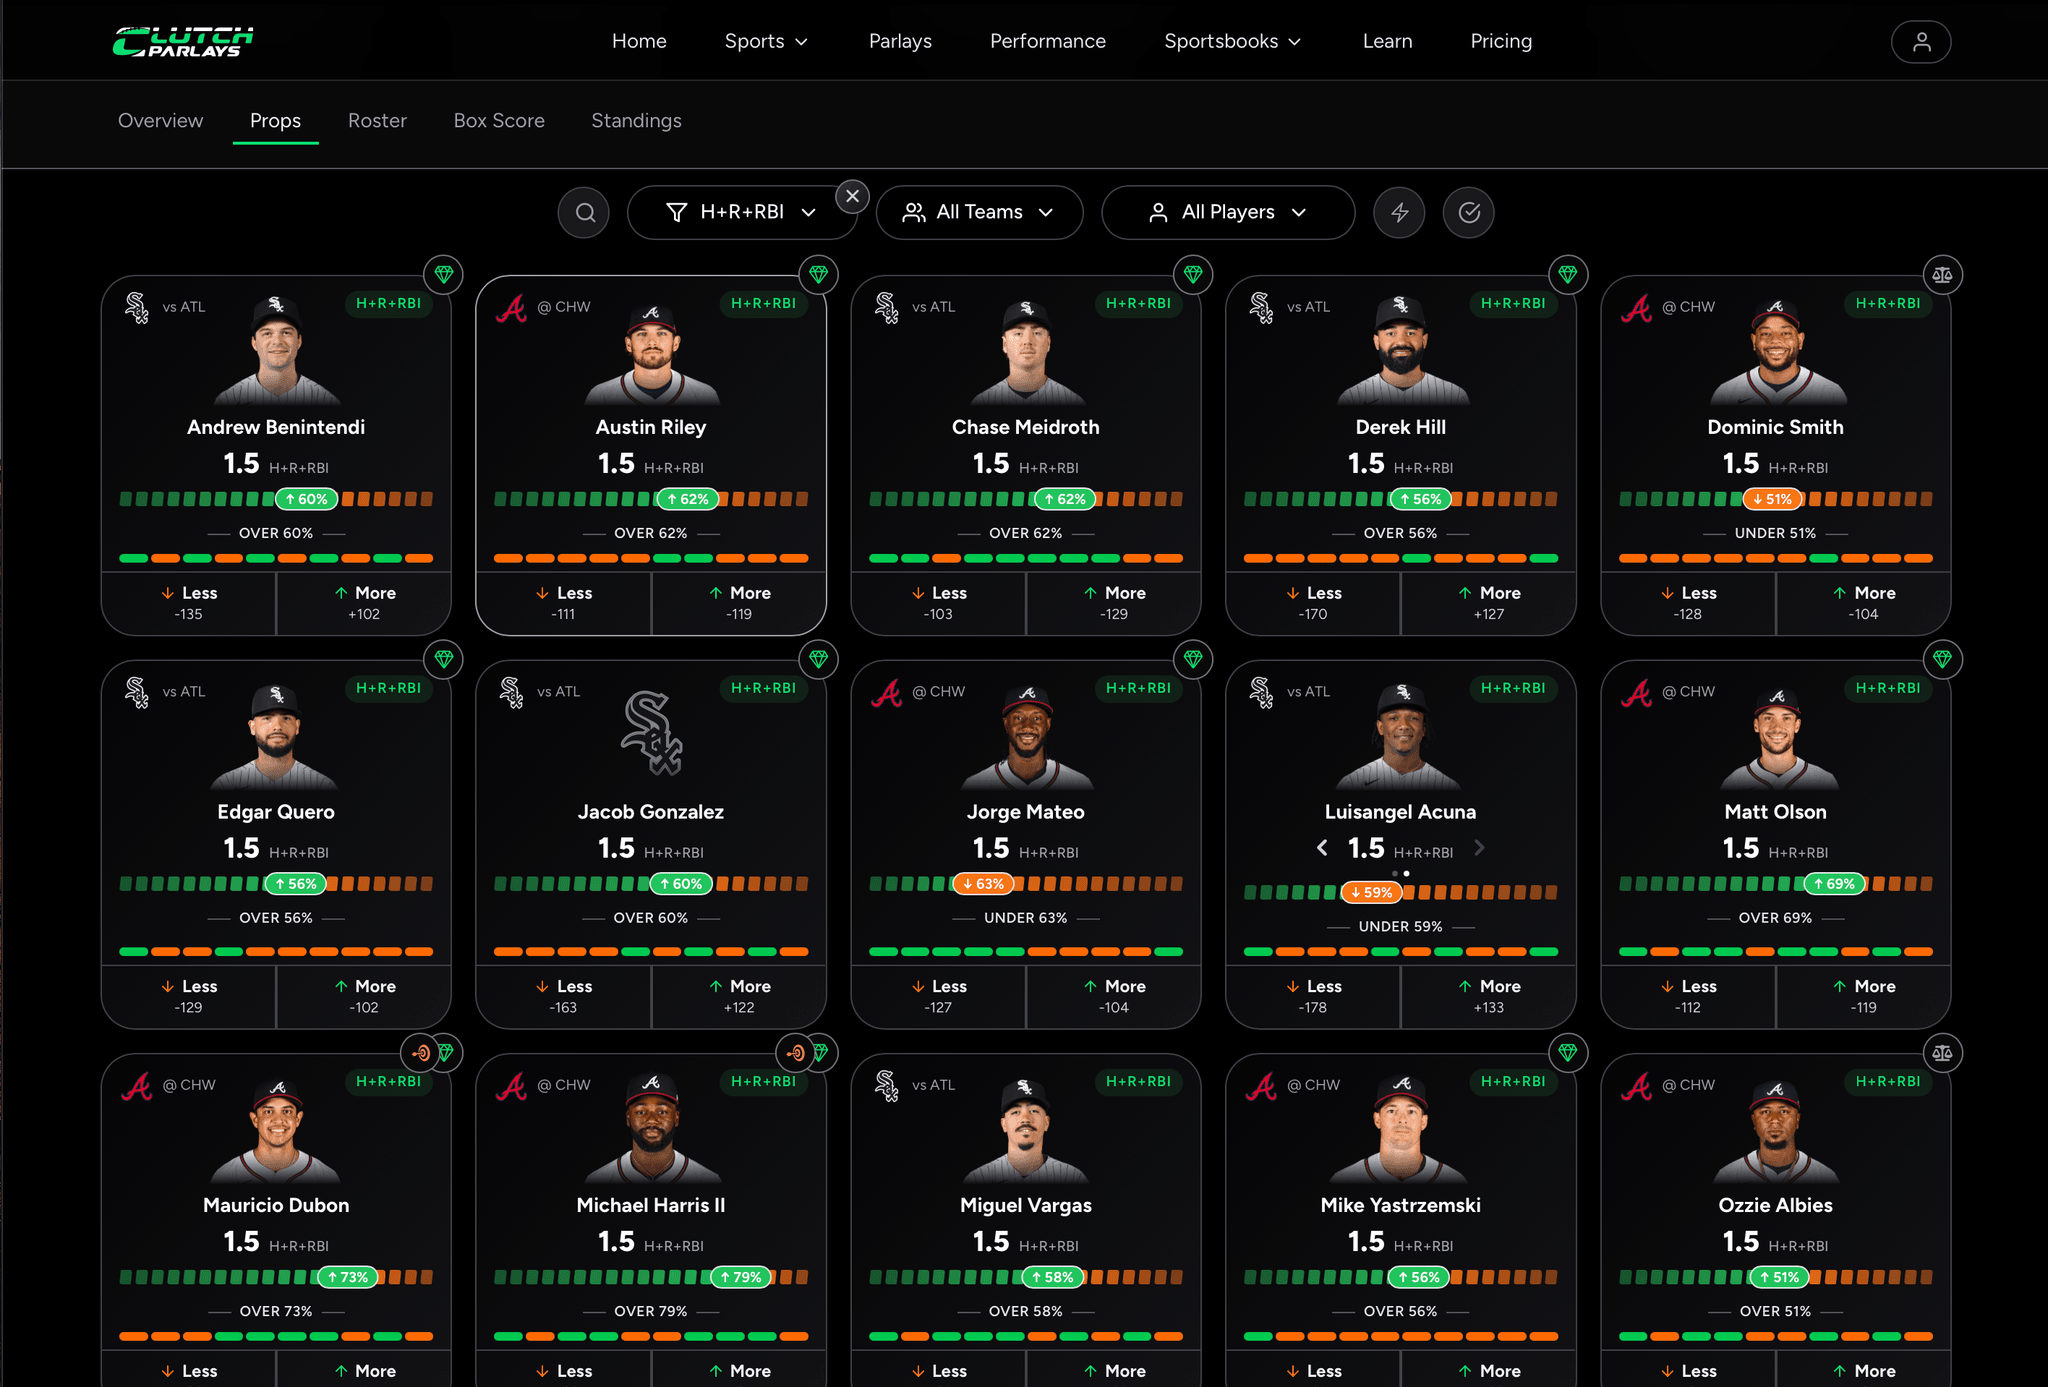
Every player prop on the game with model confidence and edge baked into each line.
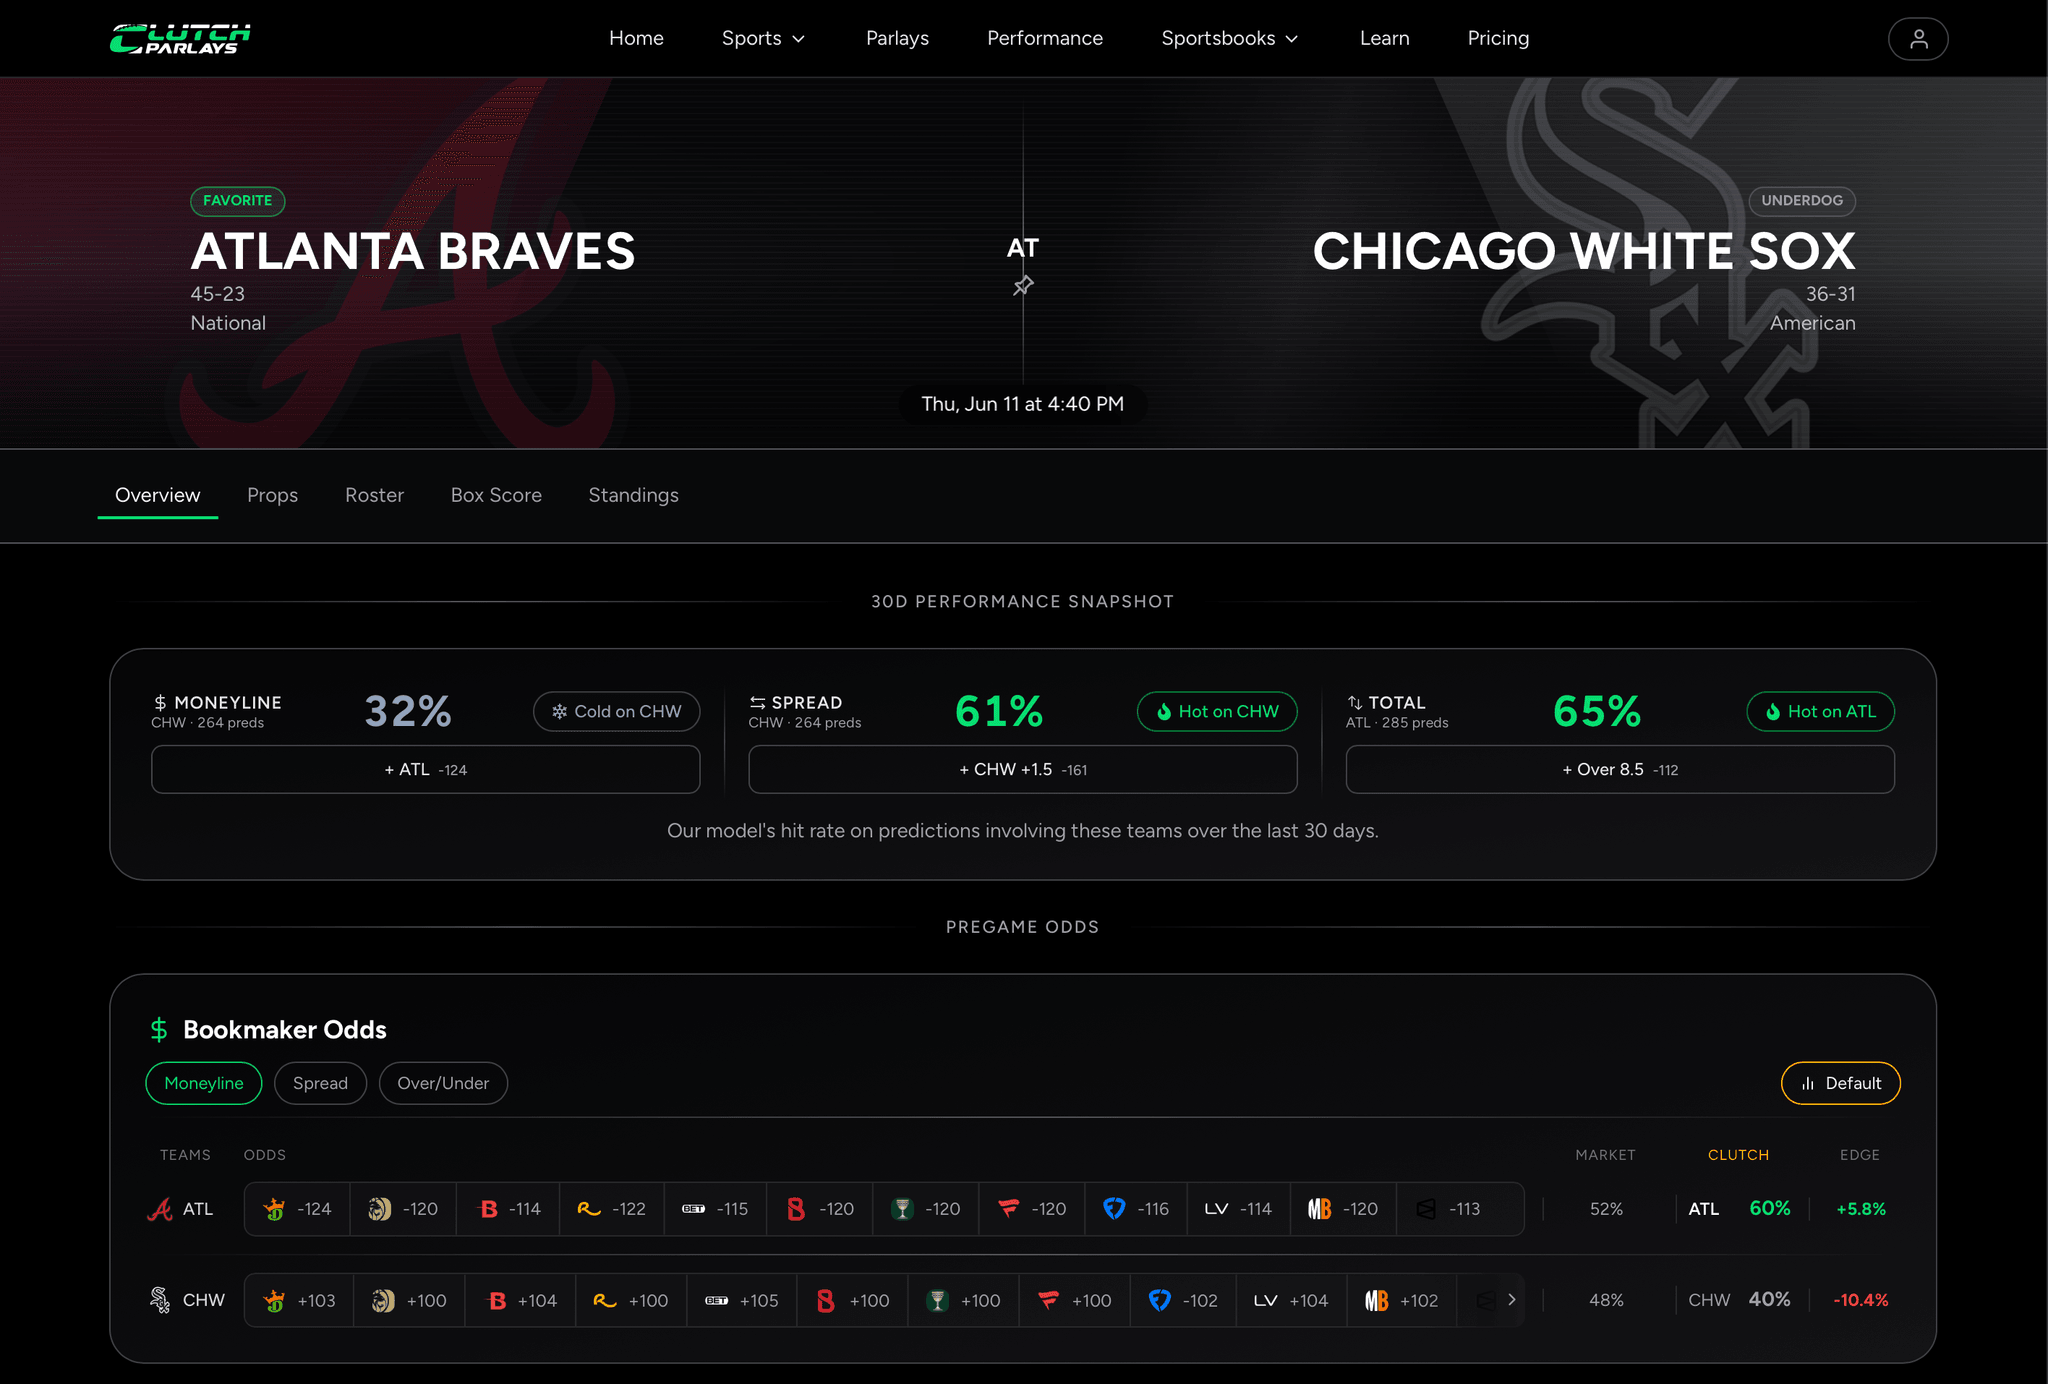
Step 2.1 — Deep Dive
The blocks on the page
The game page stacks every signal we have on a matchup. Tap any block below to expand it and see the live mock.
Bookmaker Odds
Every sportsbook's price for the matchup side by side, with the best line highlighted. Switch bet type, sort by best, and see the market consensus next to our Clutch read and the edge in one row.
Bookmaker Odds
How to Get Started
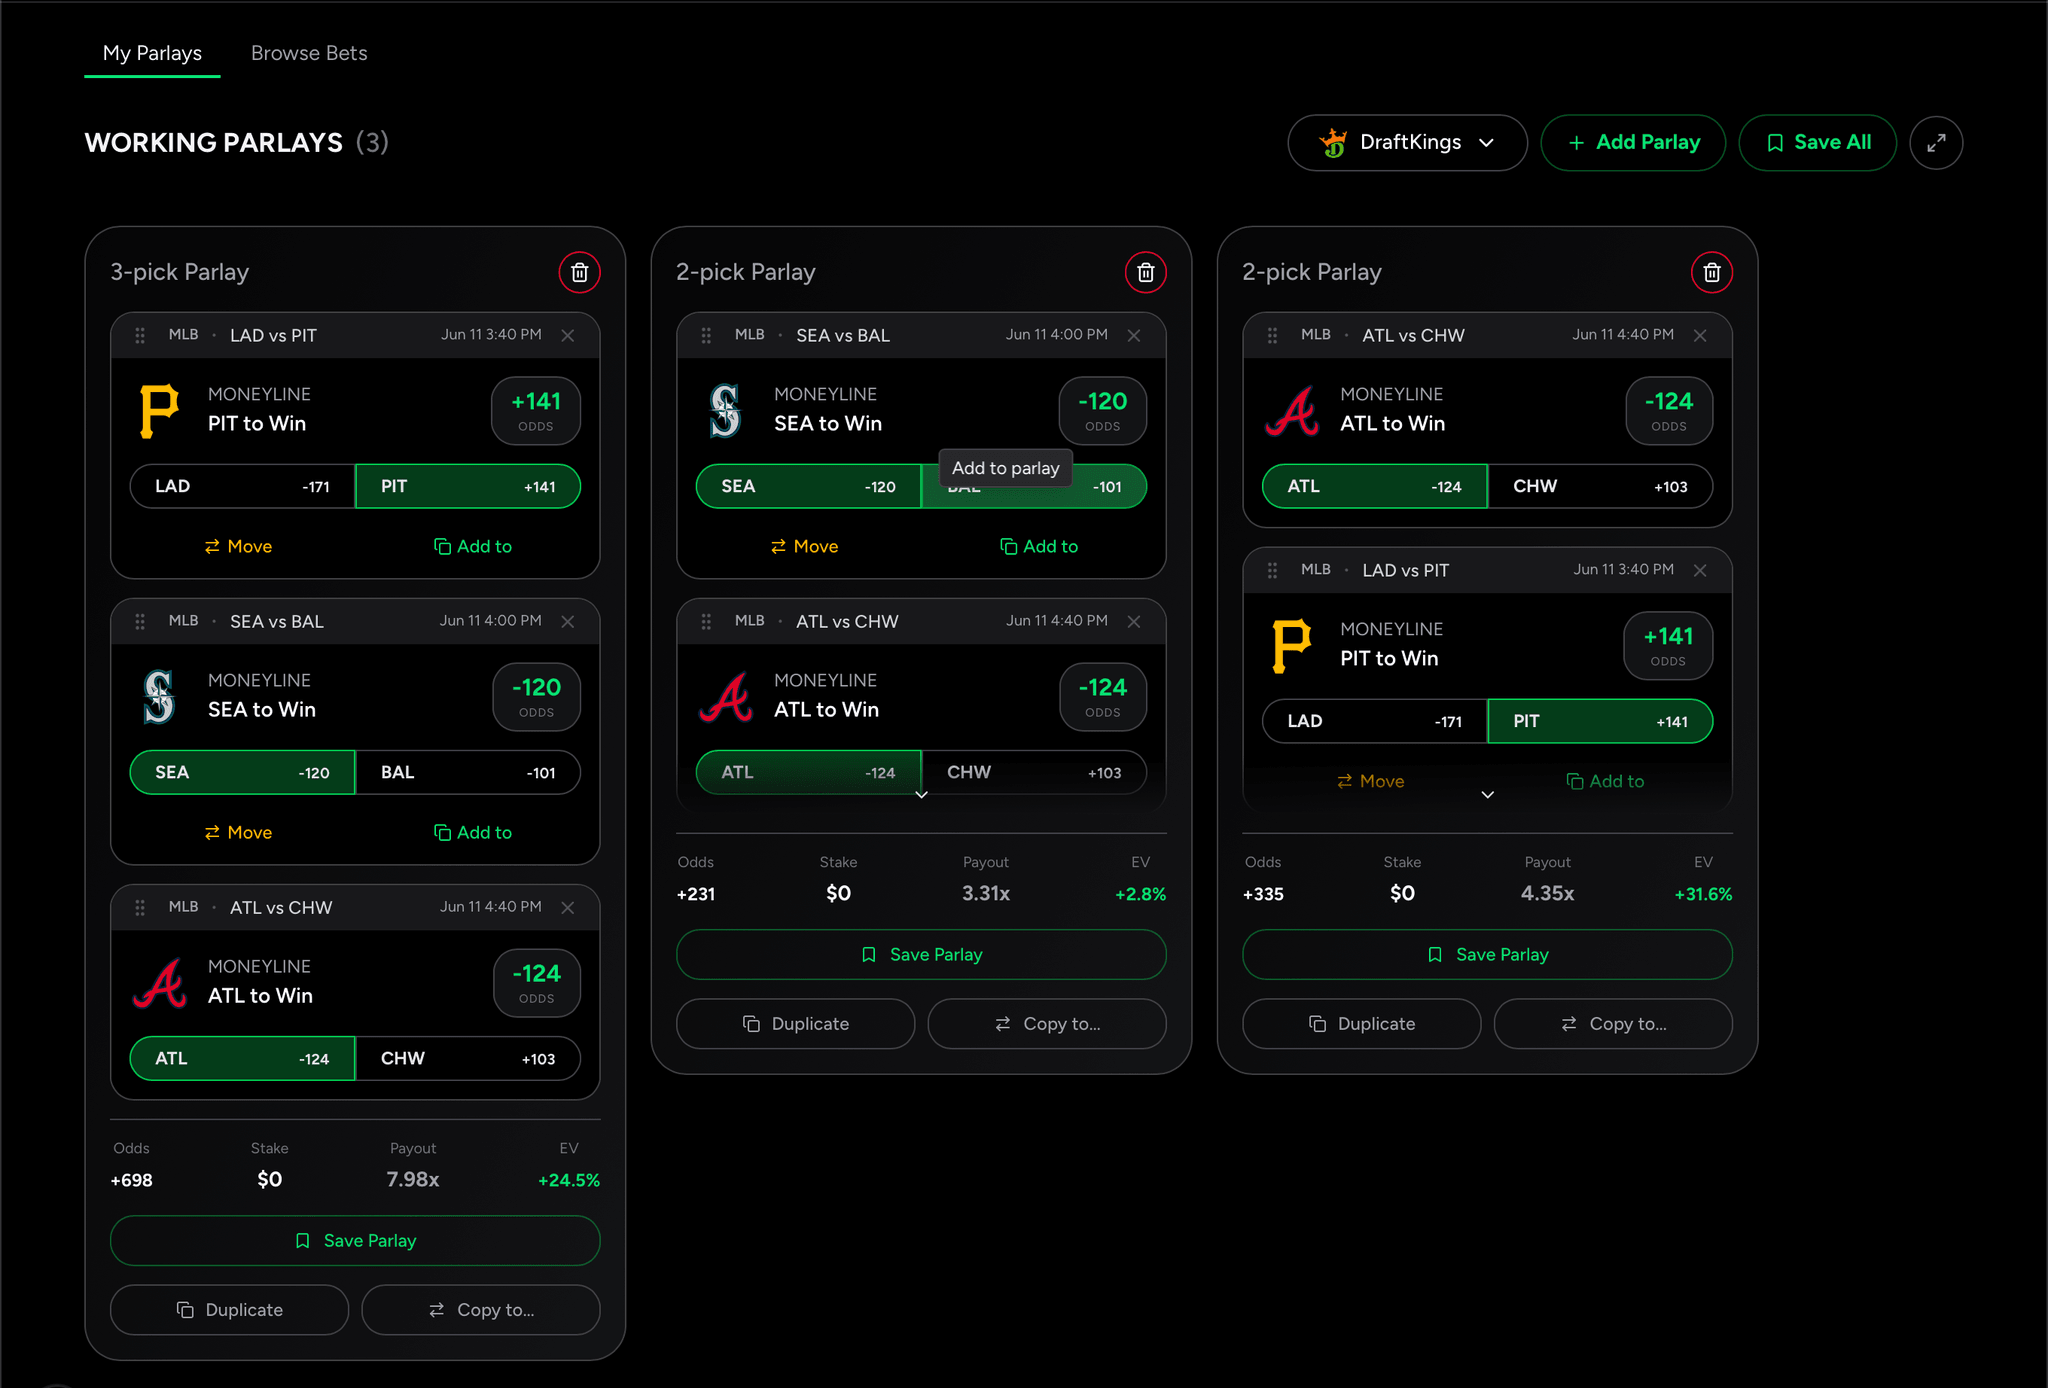
Build a parlay
Tap any pick button on a card and it stacks into your parlay drawer at the bottom of the screen. Edit legs, see live payout updates, and save when it's ready.
Parlay 1
- nba•LAL vs BOS7:30 PMspreadLAL +3.5-110Odds
- nba•DEN vs GSW10:00 PM

 over / underOver 228.5-105Odds
 - mlb•NYY vs HOU8:05 PM
 moneylineNYY to Win+135Odds
Step 3.1
Manage your parlays
Save it
Hit Save Parlay to lock it in. Saved parlays land on the Parlays page where you can track results live.
Copy to… other bookmakers
Found a better price elsewhere? Copy your parlay to DraftKings, FanDuel, BetMGM, or any other supported sportsbook in one tap.
Duplicate parlays
Clone a parlay to riff on a new variant without losing your current one.
Trash it
Don't like how the parlay looks? Trash the whole thing and start fresh.
Parlay 1
- nba•LAL vs BOS7:30 PMspreadLAL +3.5-110Odds
- nba•DEN vs GSW10:00 PMover / underOver 228.5-105Odds
- mlb•NYY vs HOU8:05 PMmoneylineNYY to Win+135Odds
How to Get Started
The Parlays page
The Parlays page is your mission control for every parlay you're building or have already placed.
Working Parlays
Drafts you haven't saved yet, organized as a kanban board across every supported bookmaker. Drag legs between books to compare the same parlay at different prices.
Saved Parlays
Every parlay you've saved, with live status pills — pending, live, won, lost — and the wager → payout breakdown. Sort by date, profit, or status.
Track results as games settle
Status auto-updates as games go final. Tap any saved parlay to drill into each leg with its result, the score, and how the line moved post-bet.
How to Get Started
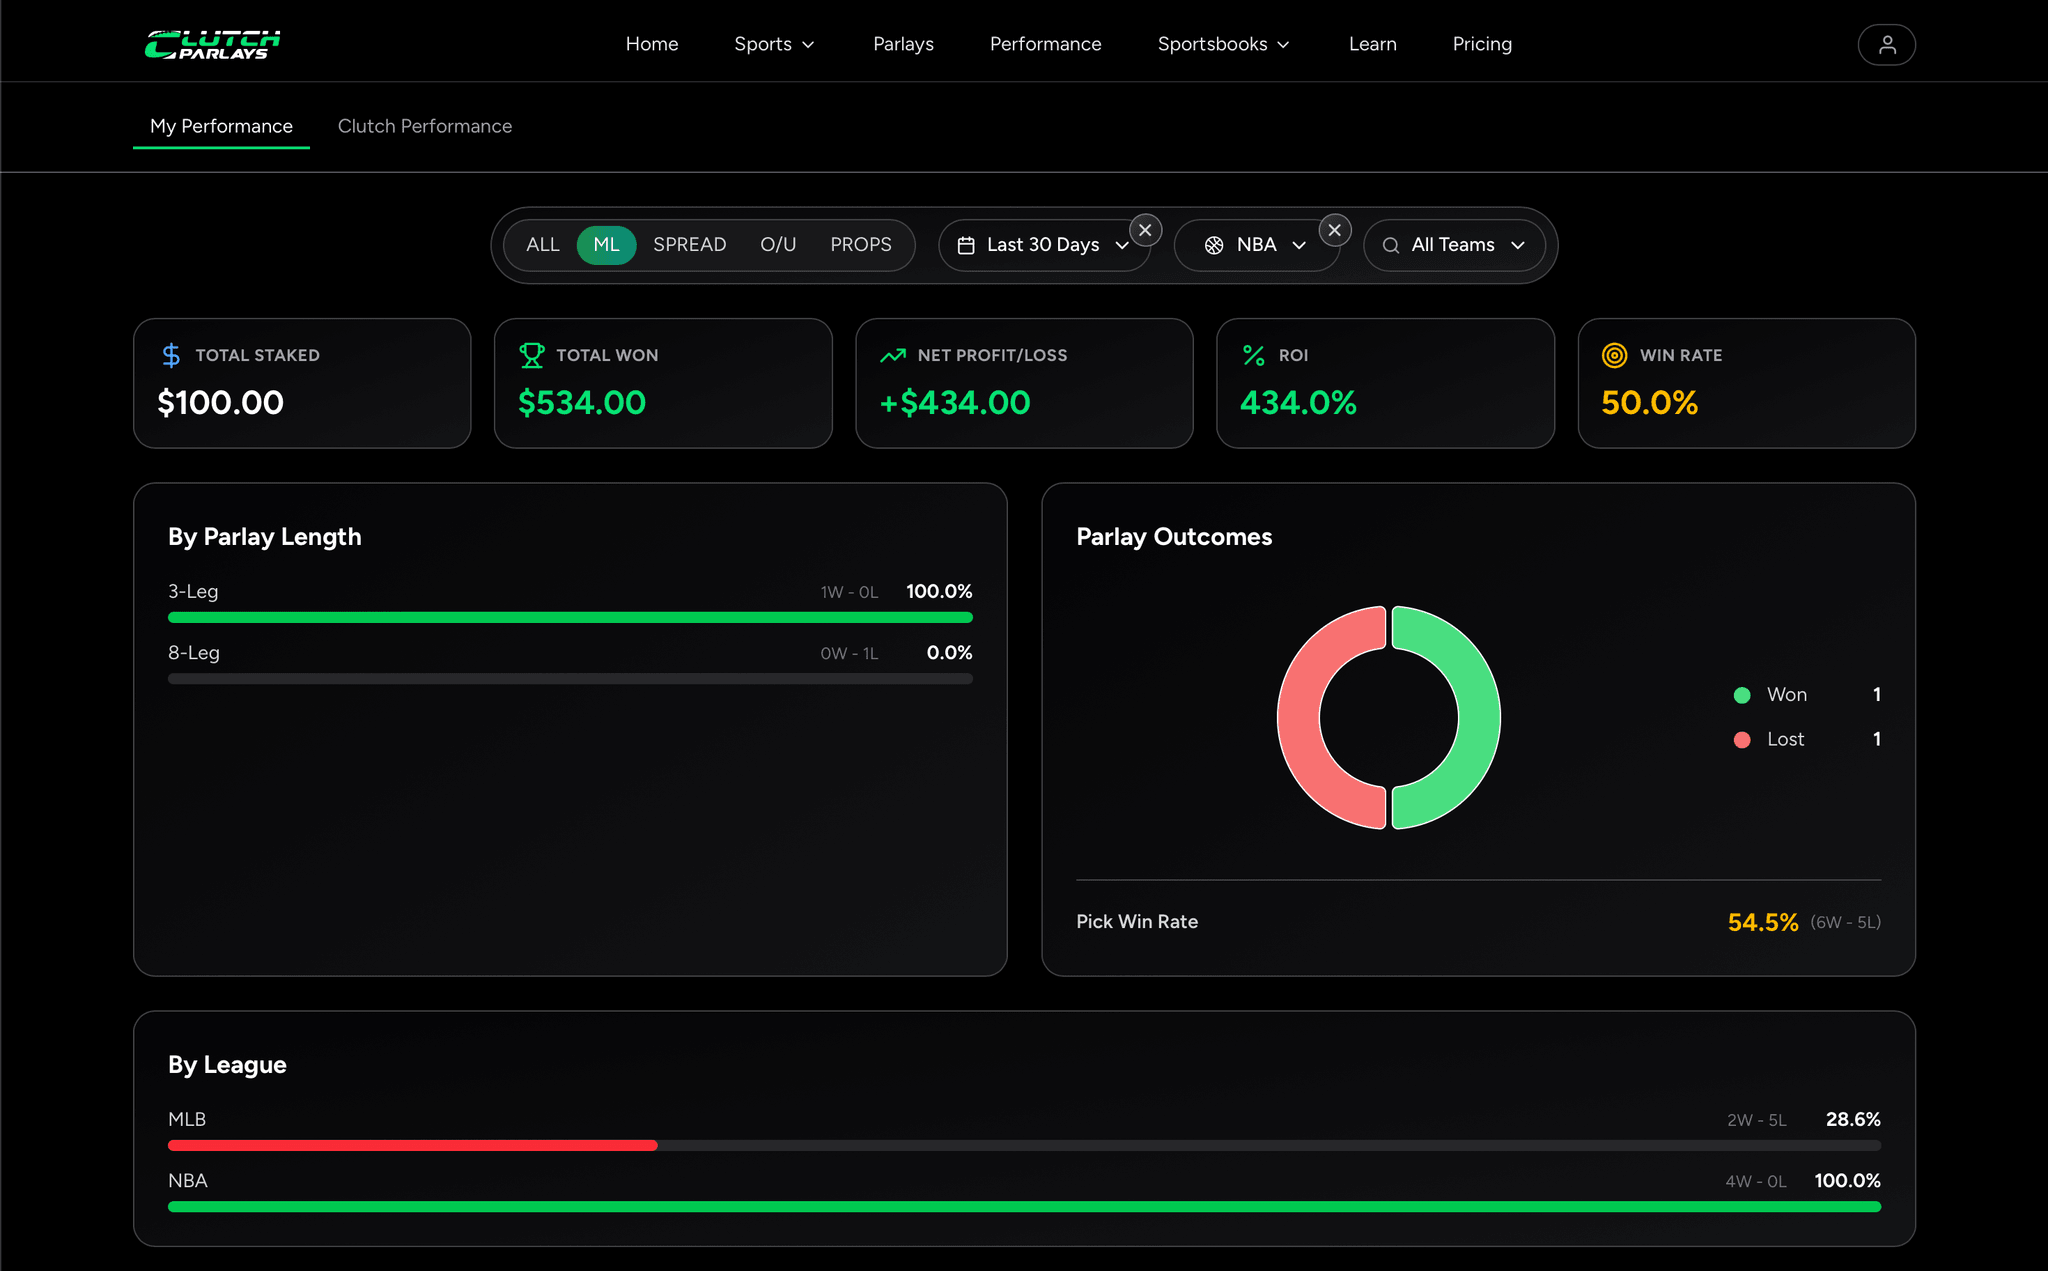
Track your performance
Every saved parlay, every bet type, every result — broken down so you can see exactly what's working.
Net Profit · Last 30 days
From $0.00 staked across 0 winning parlays
Wins
0Win Rate
0.0%ROI
+0.0%Sample run · your actual numbers live in My Performance.
How to Get Started
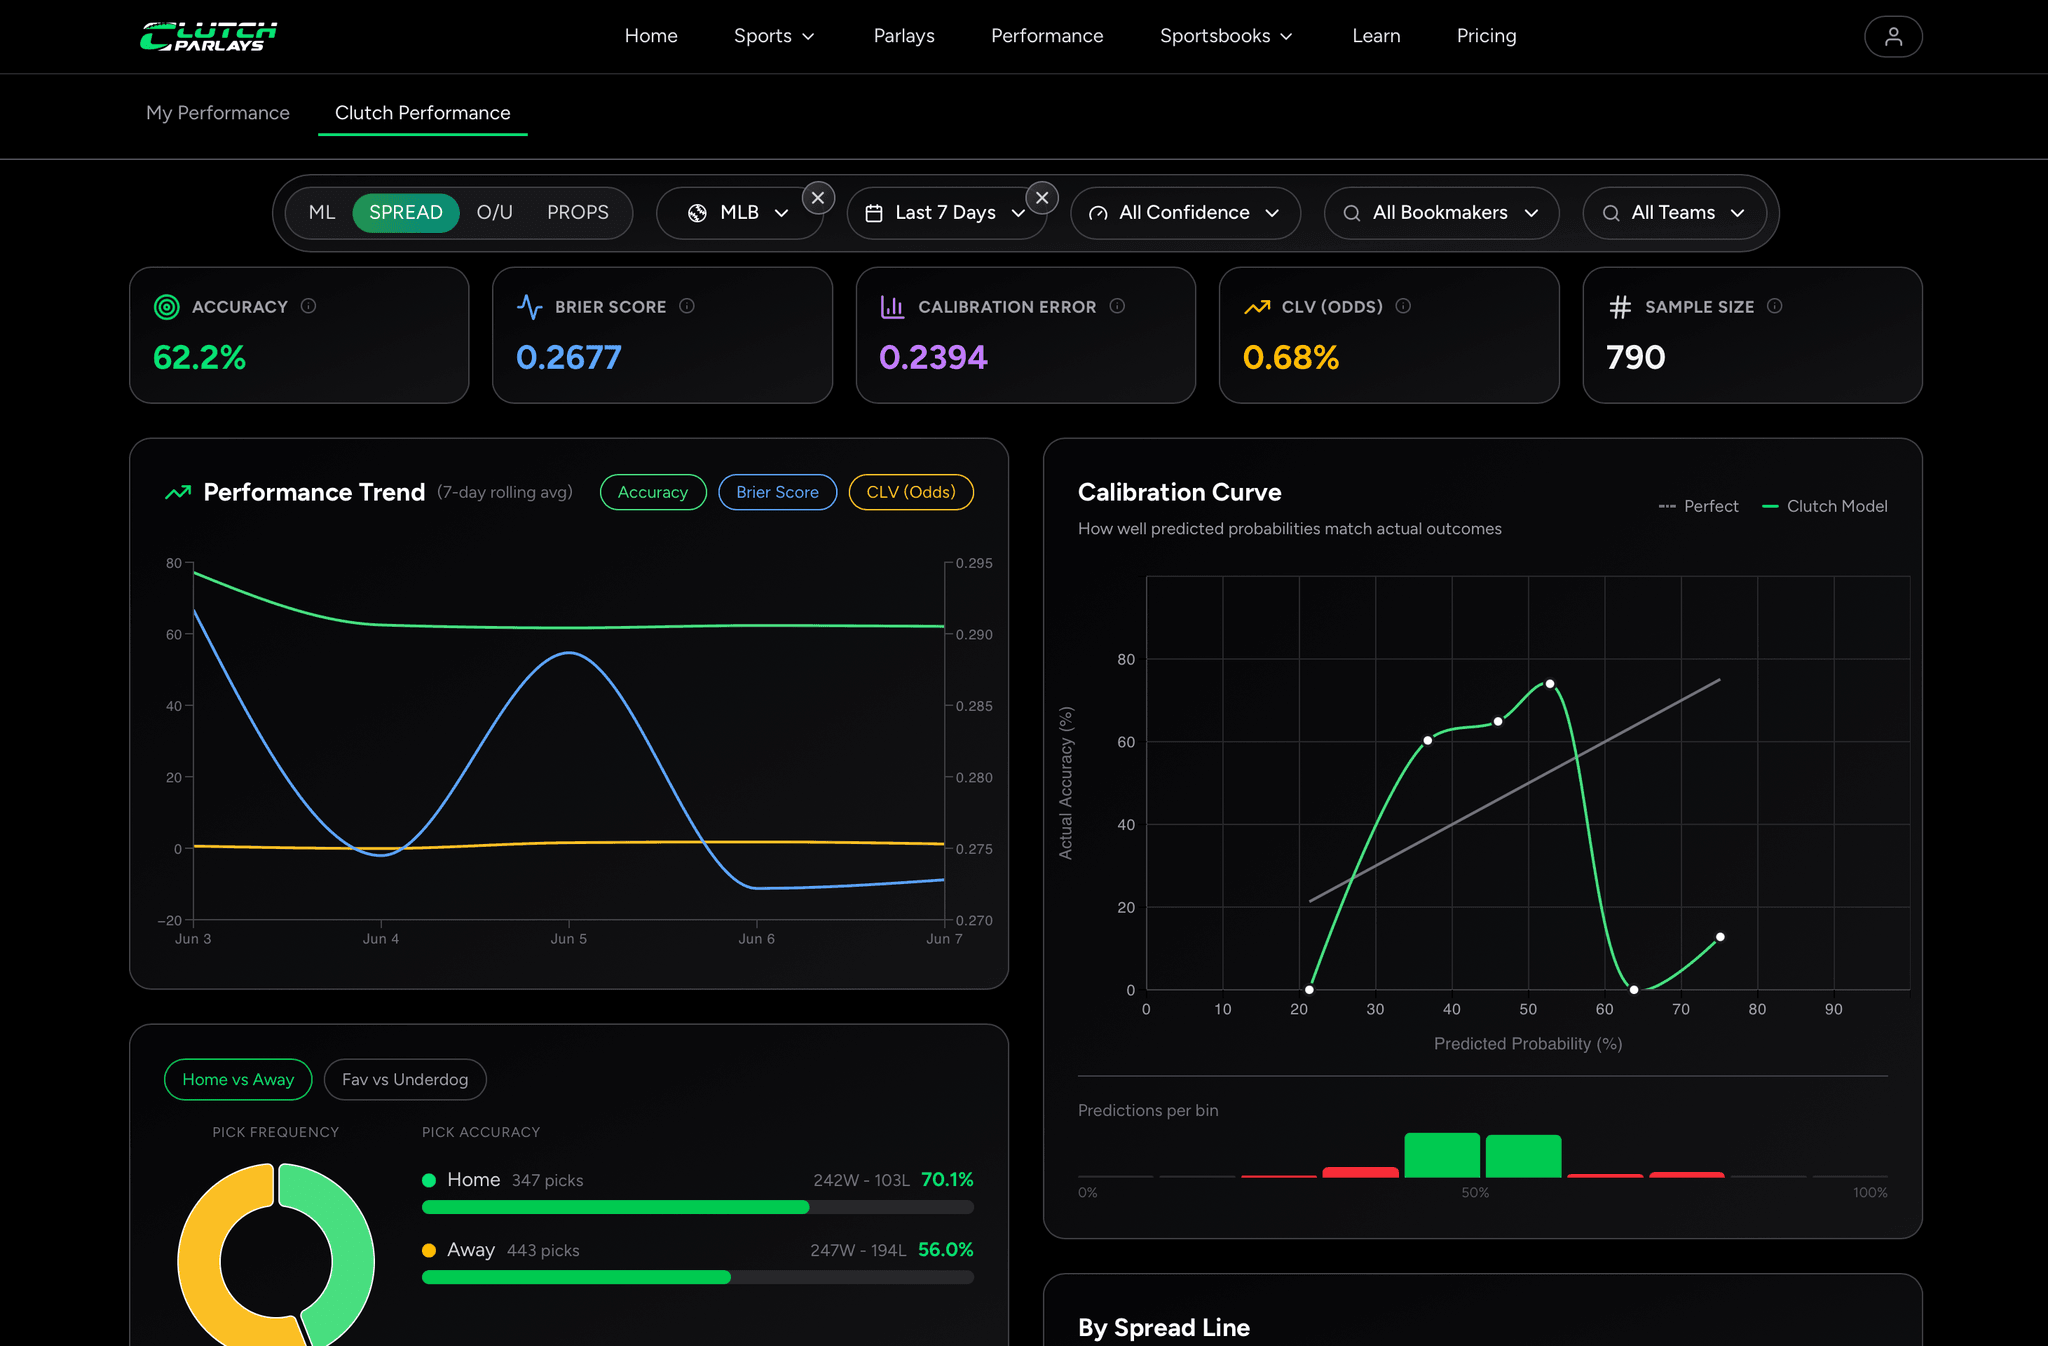
Clutch performance
Section Two
The four bet types
Every wager on Clutch falls into one of these. Pick the one that matches your read on the game.
Moneyline
MLPick who wins outright. No point spread. Underdogs pay more, favorites pay less.
Spread
SPREADFavorite must win by more than the spread. Underdog can lose by less — or win outright.
Total (Over / Under)
O/UBet on whether both teams' combined score lands over or under a set line.
Player Props
PROPBet on individual player stats: points, rebounds, threes, passing yards, etc. Tap More (over) or Less (under).
Bet Types · Deep Dive
Player props, closer up
Props zoom in on individual players. The bookmaker sets a line — say 26.5 points — and you bet whether the player finishes the game over or under it.
Tap any prop card to open the full prop modal — the same data, expanded with the model's read, last-10 game chart, and EV broken out per side.
Pick + confidence
The model's side, its confidence, and the edge versus the book's implied probability — all in one glance at the Analysis row.
Predicted value
Our point-estimate for the stat (e.g. 28.4) plus the sigma (±5.2). Tighter sigma = more confident projection.
Last 10 games chart
Bar chart of the player's last 10 results vs the current line. Green bars hit the over, orange bars missed. Dashed line = the prop line.
EV per side
Under EV and Over EV in actual dollar terms (per $1 wager). Positive EV on either side = profitable bet long-run.
Jayson Tatum
Jayson Tatum
Analysis
Over
64.0%
+6.3%
28.4 ±5.2
-$0.45
+$0.82
Last 10 Games
Bet Types · Deep Dive
Player props, closer up
Props zoom in on individual players. The bookmaker sets a line — say 26.5 points — and you bet whether the player finishes the game over or under it.
Jayson Tatum
Tap the card to open the full breakdown
Jayson Tatum
Analysis
Over
64.0%
+6.3%
28.4 ±5.2
-$0.45
+$0.82
Last 10 Games
Pick + confidence
The model's side, its confidence, and the edge versus the book's implied probability — all in one glance at the Analysis row.
Predicted value
Our point-estimate for the stat (e.g. 28.4) plus the sigma (±5.2). Tighter sigma = more confident projection.
Last 10 games chart
Bar chart of the player's last 10 results vs the current line. Green bars hit the over, orange bars missed. Dashed line = the prop line.
EV per side
Under EV and Over EV in actual dollar terms (per $1 wager). Positive EV on either side = profitable bet long-run.
Section Three
The Numbers
The math behind every line, prediction, and edge — distilled. Read odds like a pro and spot value the rest of the room misses.
The Numbers
American odds
Sportsbooks quote prices as positive (+) or negative (−) numbers. Negative tells you what you risk to win $100. Positive tells you what $100 wins.
Decimal odds = (positive odds ÷ 100) + 1, or (100 ÷ |negative odds|) + 1.
The Numbers
Win & implied probability
Every bet shows two probabilities side-by-side: what our model thinks will happen, and what the book's odds imply.
Implied probability:
Negative odds → |odds| / (|odds| + 100)Positive odds → 100 / (odds + 100)Game bet · Model picks LAL 58% to win
Player prop · 64% chance over the line
The Numbers
Edge & expected value
Edge is the gap between what we think will happen and what the book is paying. Positive edge = value on the table.
Expected value (EV) turns that edge into a per-bet expected return — positive EV means the bet is profitable in the long run.
Strong Edge
Edge > 5% — high value bet
Moderate Edge
Edge 0-5% — some value
Negative Edge
Edge < 0% — book has the advantage
Edge
Edge = Model Prob − Implied ProbModel says 55%, book implies 45% → +10% edge.
Expected value (EV)
EV = (Model Prob × Decimal Odds − 1) × 100Clutch calculates this for every bet — sort by EV to find the most profitable plays.